Introduction
In this article, we’ll learn how to create a Funnel Exploration in Google Analytics 4 (GA4).
GA4’s Funnel Exploration helps you visualize user progress through key stages of your website or app. Unlike previous versions of Google Analytics, it offers a more intuitive and flexible way to track user behaviors, pinpoint where drop-offs occur, and provide you with valuable insights into the user journey.
It is very useful to analyze the e-commerce funnel steps: product views, add-to-cart, checkout, payments, shipping, and purchase.
You can add or edit funnel steps, add filters, and use GA4 advanced features such as time constraints, segment comparison, and next actions to really know what is going on with your user journey.
Let’s dive into the step-by-step process of creating a Funnel Exploration in GA4.
A step-by-step guide to creating a Funnel Exploration Report in GA4
Step 1) Creating a New Funnel Exploration
- To get started, click on the Explore Tab in Google Analytics 4
- You have two options to create a funnel exploration
- Option 1 Click on Blank Exploration to create a Funnel from scratch.
- Option 2: Funnel exploration template. It comes with four pre-configured funnel steps.
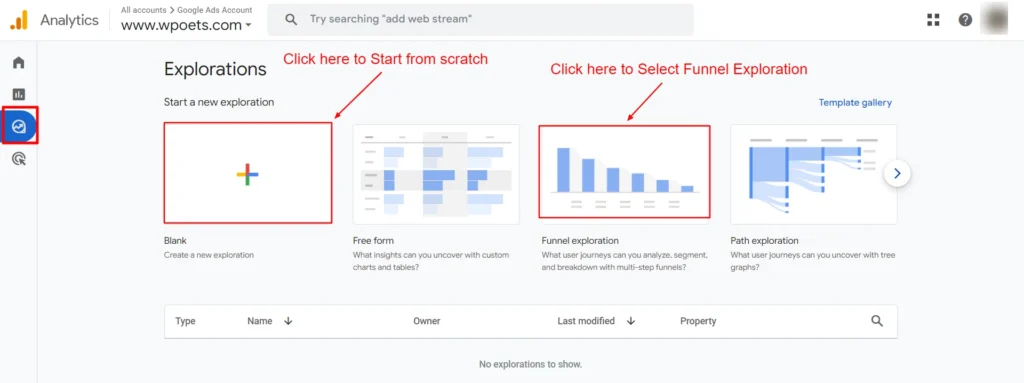
Screenshot 1: Select New Exploration
- Then click on the Exploration Name to give it a name to reflect its purpose.
- Select the date range and then simply click on apply.
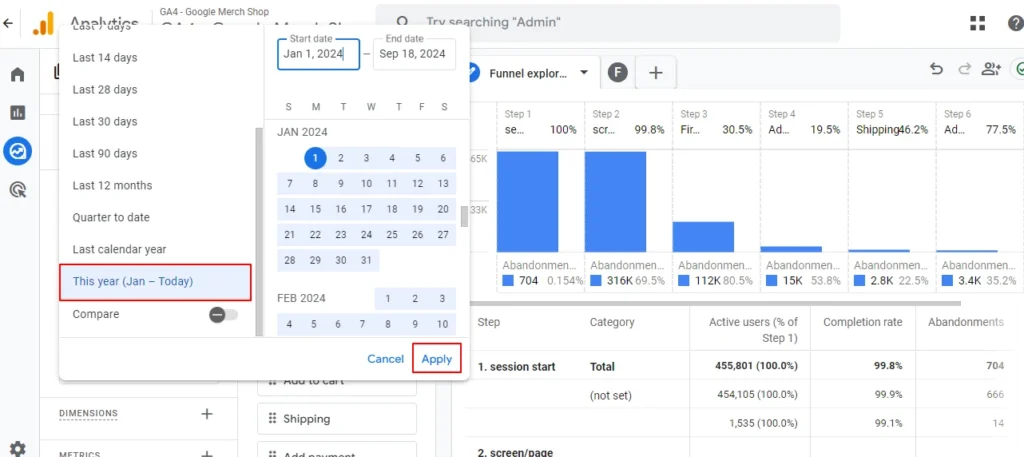
Screenshot 2: Select the Date range
- Then choose the Funnel exploration from the Technique dropdown if you have selected a blank exploration template. Otherwise, the exploration technique is already set to the Funnel exploration; if the template is selected,
- Now, simply add or edit steps to the funnel exploration as per your needs. In Step 5 of this blog, we will look in detail at how to create funnel steps.
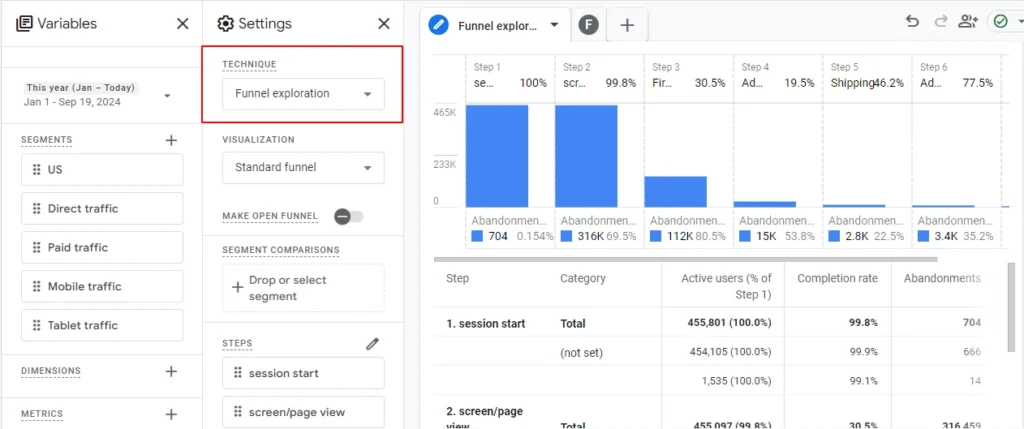
Screenshot 3: Choose the Technique as Funnel Exploration
Step 2) Visualization
- In Google Analytics 4 (GA4), when creating a Funnel Exploration report, you can choose between two types of funnel visualizations: Standard Funnel or Trended Funnel. Each serves a different purpose in terms of data analysis.
- Standard funnel: This is a static, point-in-time visualization of how users move through a funnel. It helps you analyze the conversion process at specific steps to understand user behavior and identify drop-offs at each stage.
- Trended Funnel: A time-based funnel shows how users move through each stage over time, which makes it easier to spot trends and patterns in how users behave across sessions or days.
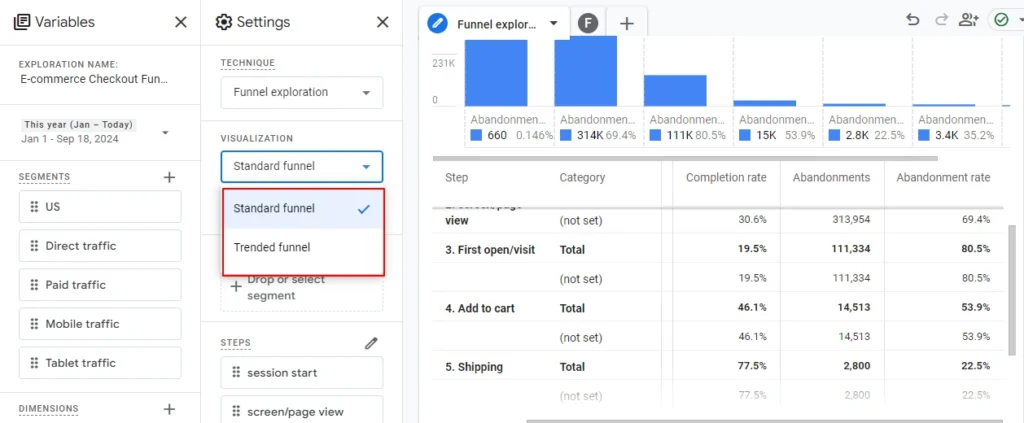
Screenshot 4: Click on the dropdown to Select Visualization
- Below are the examples of the Standard and Trended funnel in screenshots 5 and 6 respectively.
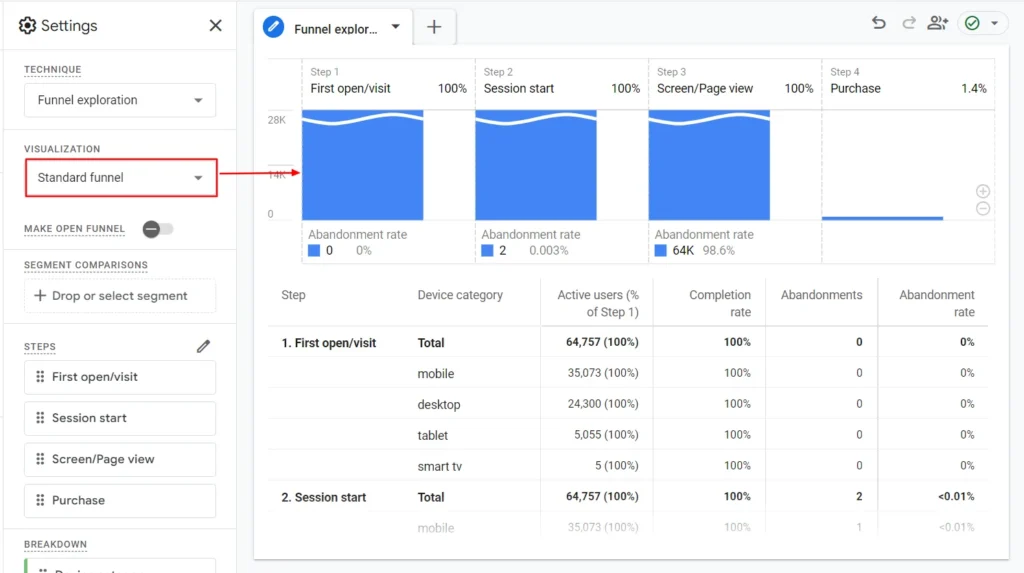
Screenshot 5: Standard Funnel example
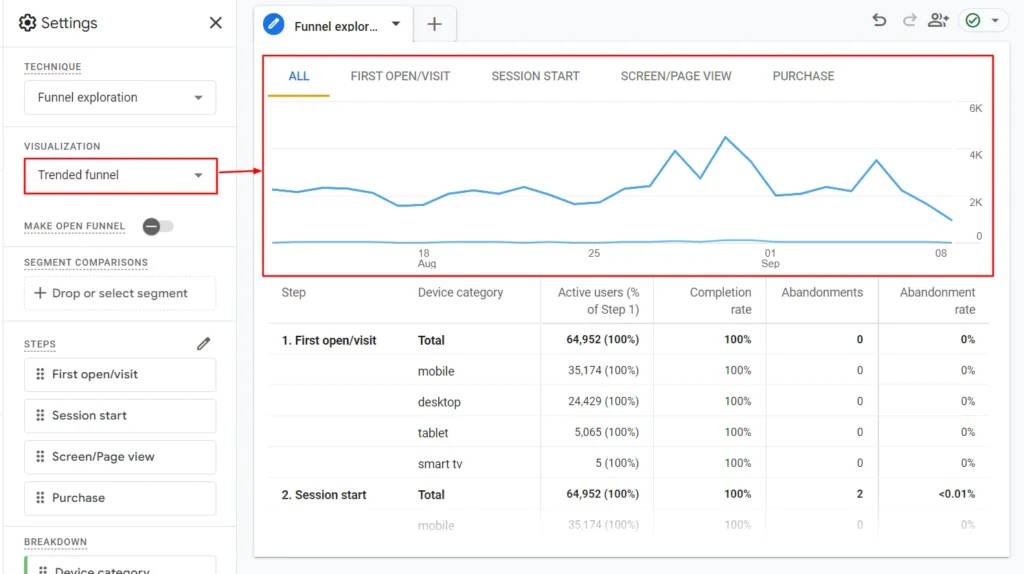
Screenshot 6: Trended funnel
For this blog post, we will go with the Standard funnel.
Step 3) Open/Closed Funnel
- In Google Analytics 4 (GA4), open and closed funnels refer to the way users are allowed to enter and progress through a funnel exploration report. These options give you control over whether users can start at any step in the funnel or must follow the exact sequence of steps.
Open Funnel
- An Open funnel allows users to enter at any stage of the funnel, even if they haven’t completed the previous steps.
- For example, users might start at the Add to Cart step without necessarily viewing the product details page.
Closed Funnel
- A closed funnel requires users to complete each step in sequential order to progress through the funnel.
- For example, users must view the product page, add an item to the cart, proceed to checkout, and then make a purchase, all in order.
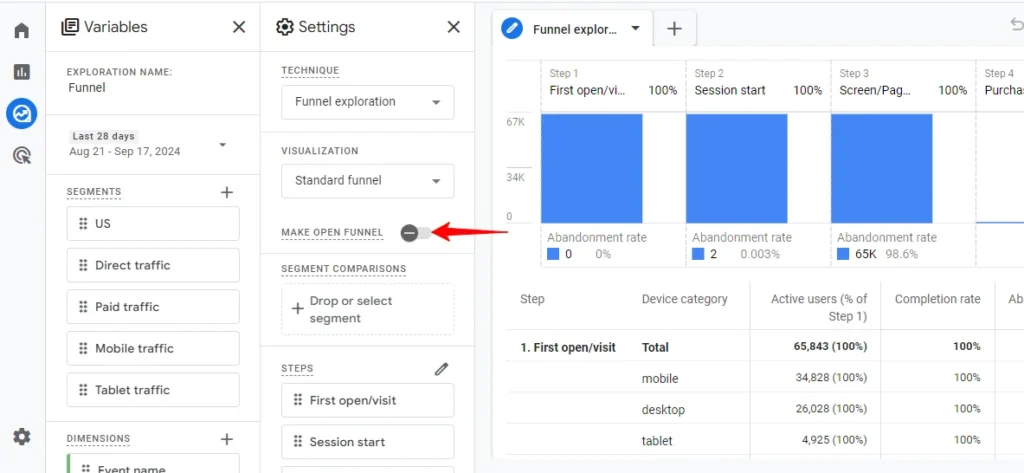
Screenshot 7: Open Funnels
Step 4) Segment Comparisons
- In GA4’s Funnel Exploration, segment comparisons show how different groups of users behave as they move through the funnel.
- You can compare up to four segments at a time.
- When a single segment is added to the Segment drop list, it shows data for that particular segment. To view data for a single segment, hover over a funnel.
- When multiple segments are added, their data will be shown side by side.
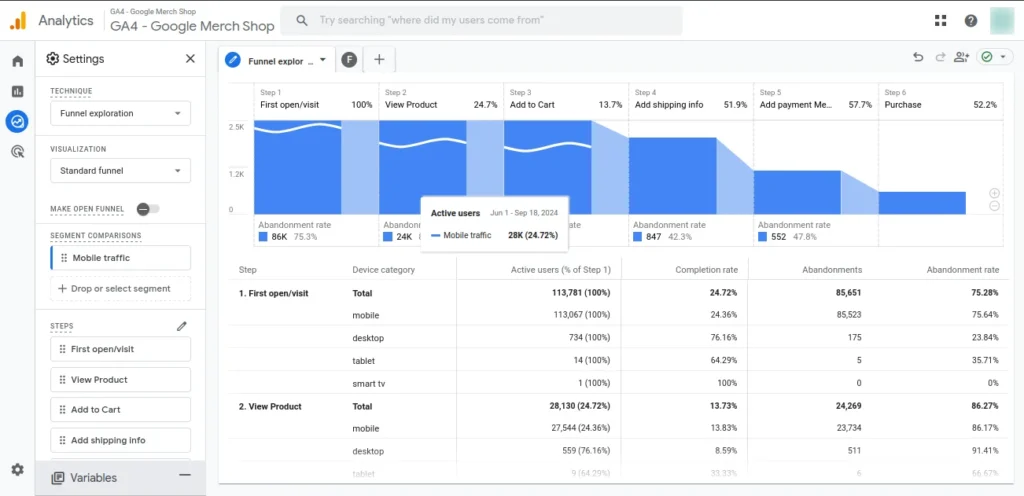
Screenshot 8: Single Segment
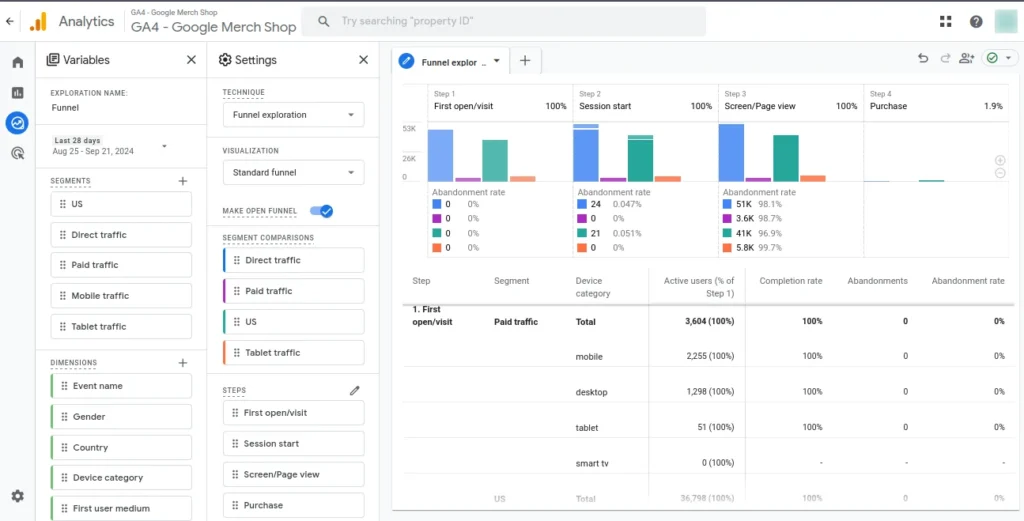
Screenshot 9: Maximum Four segments added for comparison
Step 5) Setting up the Steps of the funnel
- This is where you actually add or edit the funnel’s steps.
- We selected the funnel exploration template under the Settings panel Steps section; hence, four funnel steps are automatically added.
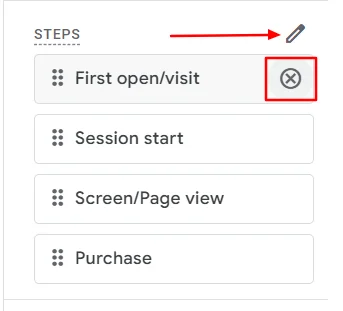
Screenshot 10: Edit or delete a step
- The steps are
- First Open/Visit: This is the first time the visitor has interacted with the site during their session.
- Session Start: Keeps track of when a person starts a session on your site.
- Screen/Page View: Keeps track of when a user visits a certain product or topic page.
- Purchase: The last step, which is done when the purchase is done.
- To add or edit steps, simply click on the pencil icon next to the Steps section. A funnel editing slideover will open up, as shown in the screenshot below.
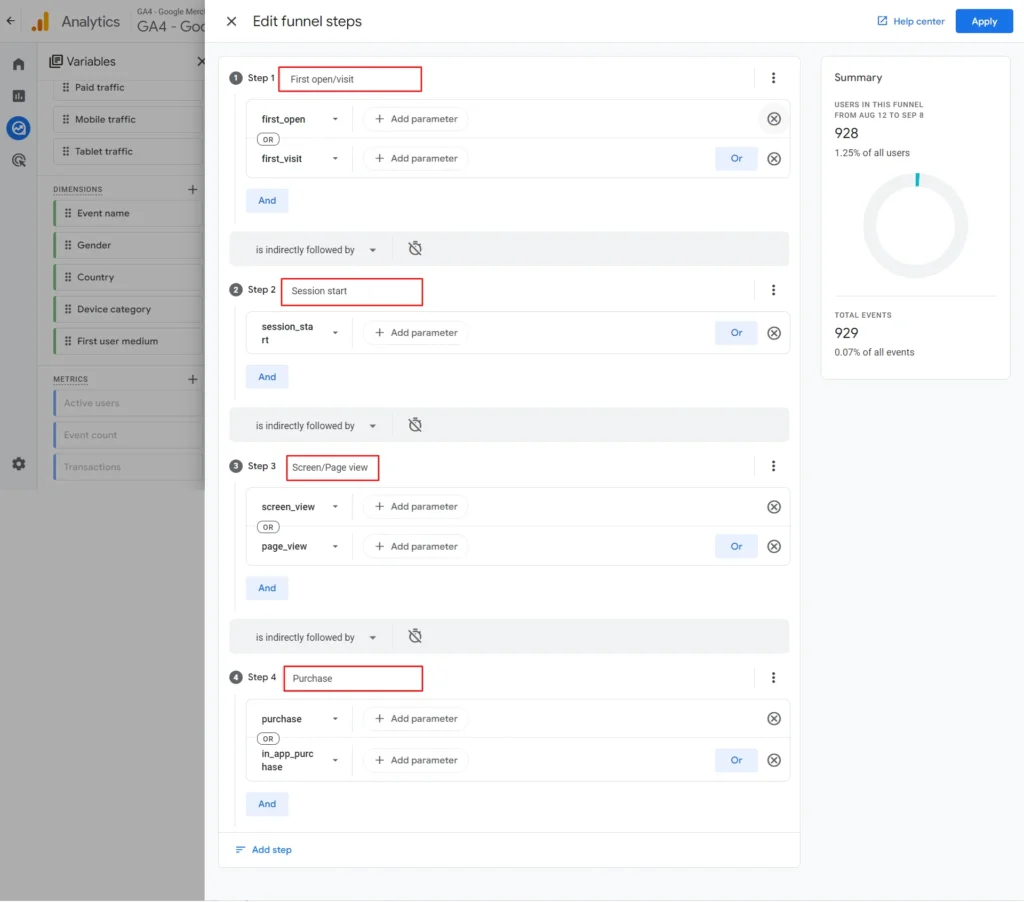
Screenshot 11: Steps in Funnel exploration template
Editing funnel Steps
- Following the previous step, you can edit the existing funnel steps.
- You can change the label or name, as well as add, edit, or remove step conditions.
- To edit a condition, click on the Event or Dimension name. It will open a list of Events and dimensions to choose from.
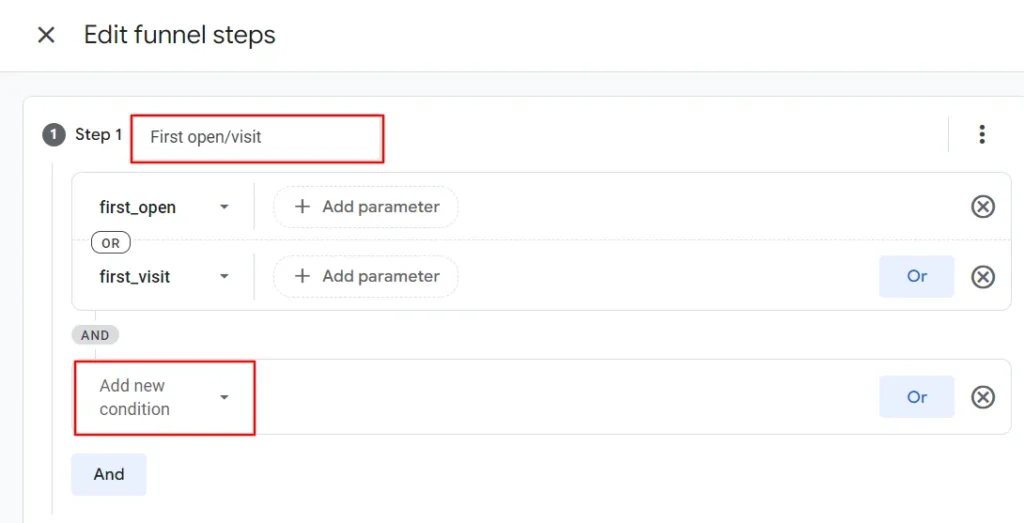
Screenshot 12: Add new Condition to the Funnel Step
- You can then add, edit, or remove conditions from the steps.
- To add a new condition to a step, type in the name of the event or dimension you want to add. As you type in, you will see a list of events or dimensions.
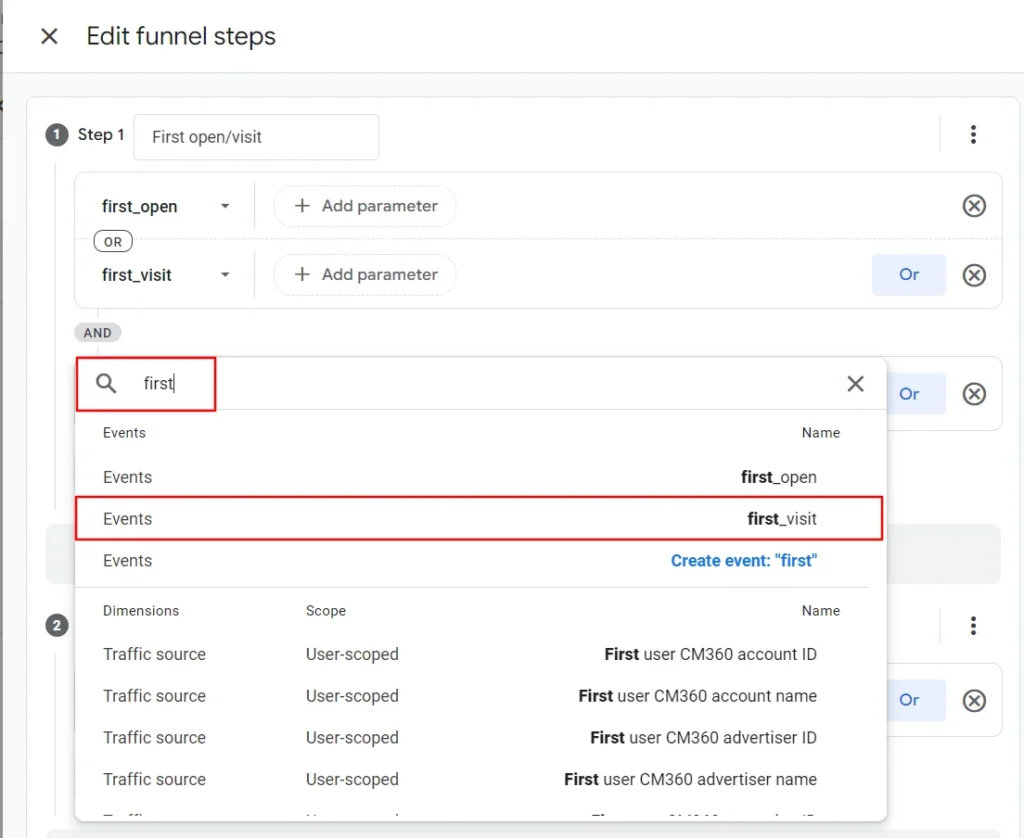
Screenshot 13: Search for Events or Dimensions
- Next, you can add OR and AND conditions, which allow you to refine how events and dimensions are filtered in steps.
- To create complex filters, you can combine multiple AND & OR conditions for more precise control.
- Example of Combining AND/OR: You want to analyze users who are from the United States or India (OR condition) AND use a Mobile device (AND condition)
- For Events, you can add parameters, and for Dimensions, you can add filters.
- Parameter: A parameter in GA4 is additional information that is sent along with an event to provide more context or detail about the action a user took. Every event in GA4 can have one or more parameters.
- Filter: Filters help narrow down the data only to show what’s relevant to your analysis for selected dimensions.
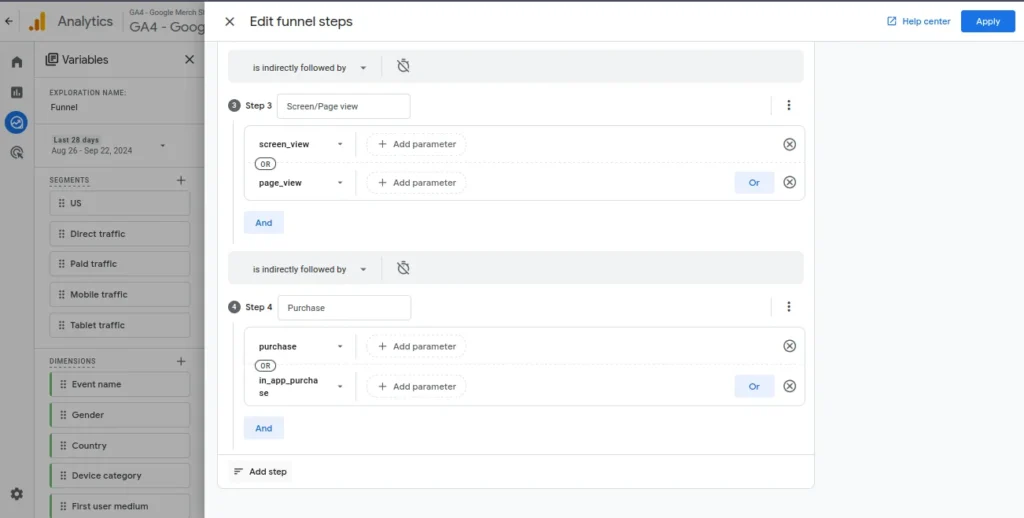
Screenshot 14: Adding AND / OR and Parameters, Filter
- Click on the three dots in the top-right corner of any funnel step. You can Copy, Remove, and Add steps above & below the current step.

Screenshot 15: Copy, remove, and add steps above or below
- If the funnel steps bar graph is not visible, you can zoom in and out by clicking on the “+” and “-” icon or zoom in using the mouse.
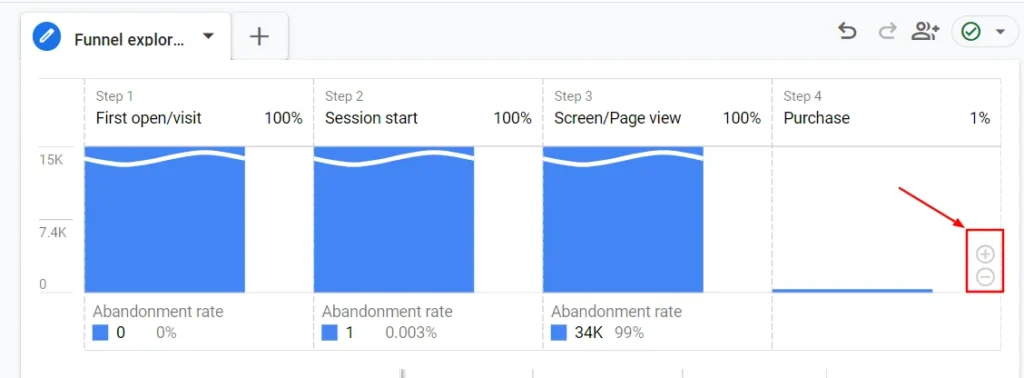
Screenshot 16: Zoom into the step
Adding Funnel Steps
- To add steps, simply click on the pencil icon, just like we did for editing steps.
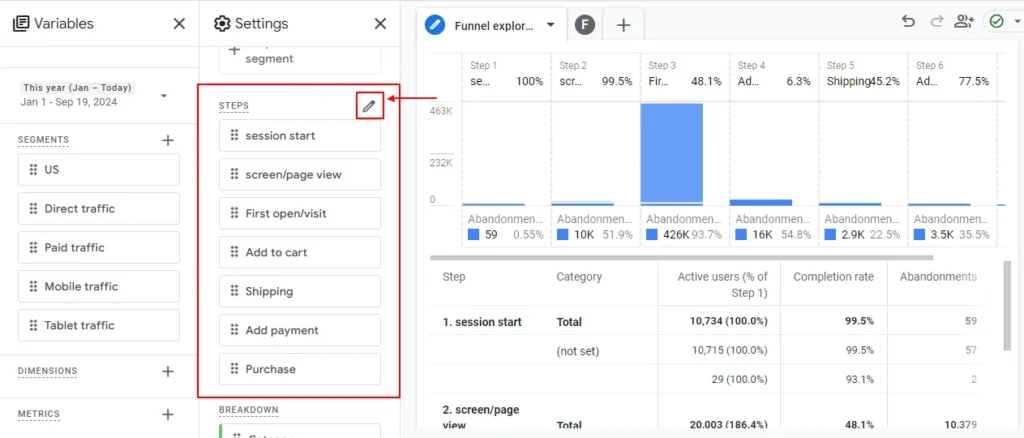
Screenshot 17: Click on the pencil icon to Edit Funnel Steps
Let’s add the Add Payment method step before the Purchase step of the Funnel as seen in the screenshot below
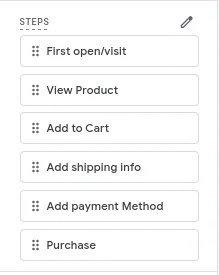
Screenshot 18: Add Payment method step before the Purchase step
- Click on Add step in the funnel steps slide over footer
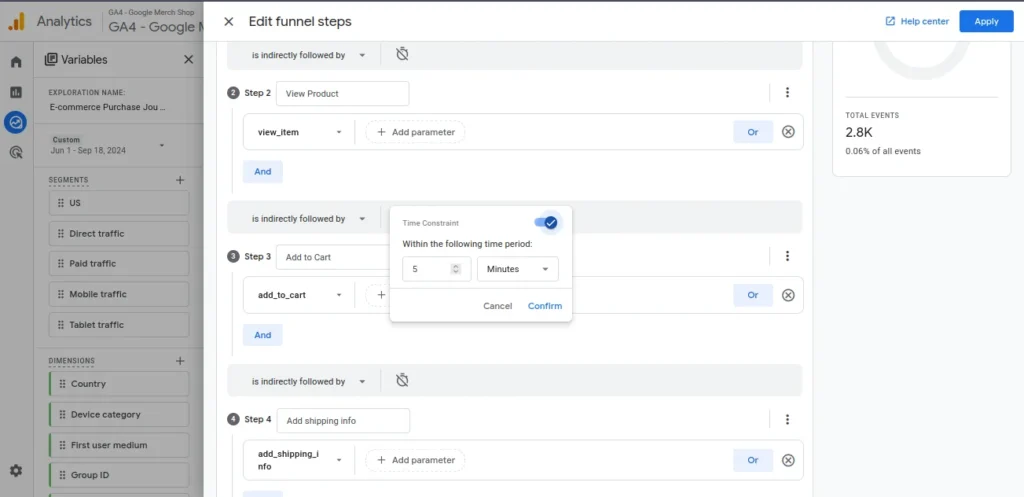
Screenshot 19: Click on the Add step in the Sequence footer
- Enter the label or name for the step as Add payment method. Always use descriptive names for clarity (e.g., “Viewed Product Page,” “Added to Cart,” “Started Checkout,” “Completed Purchase”).
- In the items list, search for payment and add it as a condition. That’s it. You have added a new step in the funnel.
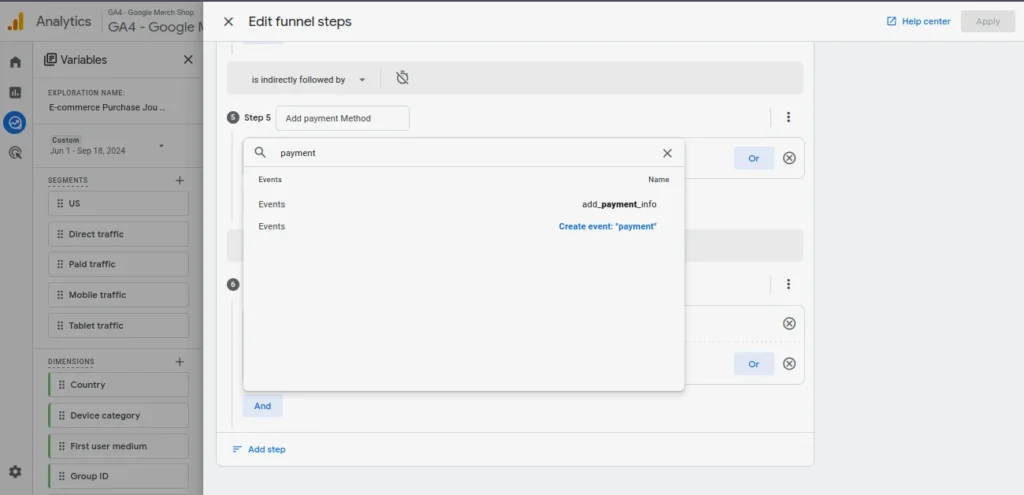
Screenshot 20: Search for payment Event item
- If needed, you can refine the events’ data (by parameters) and dimensions (by filters) in the steps.
- For example,
- Select event as add_to_cart parameter and the Price greater than 100 AND
- Add Dimension as Country contains the United States under the Geography subgroup.
Time Constraint
- You must have noticed the little clock icon beside each funnel step. It’s the Time Constraint option.
- In Google Analytics 4 (GA4), time constraints refer to the ability to set specific time limits or windows within which users must complete certain actions in a funnel exploration report.
- This feature allows you to analyze user behavior within a defined time period between different steps in a funnel, ensuring that the steps happen within a certain timeframe.
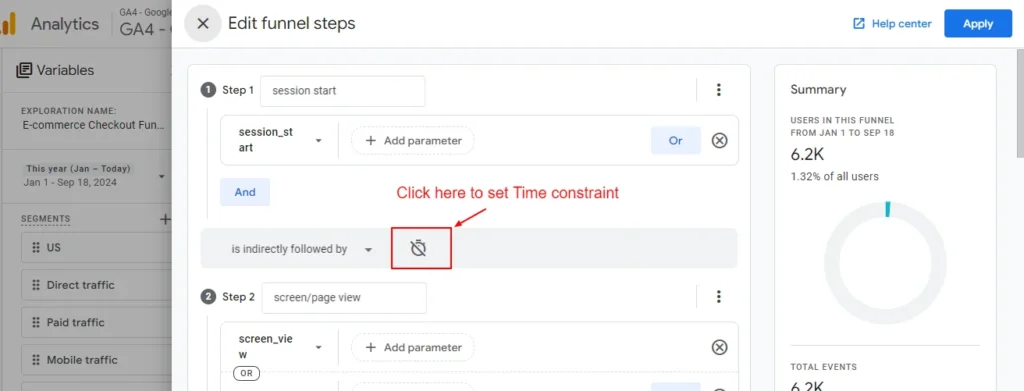
Screenshot 21: Add Time Constraint
- You can set the time period by min, days, hours, etc. within which the next step must occur for it to be included in your funnel.
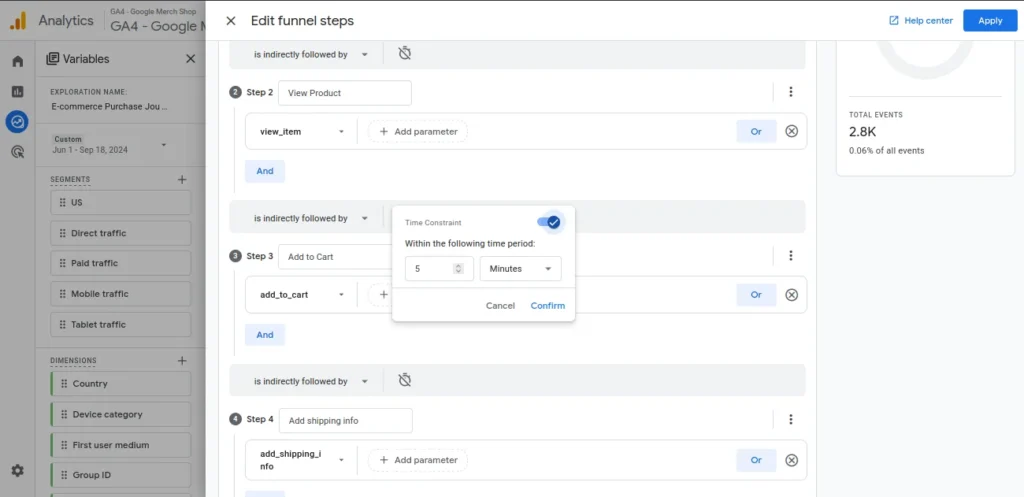
Screenshot 22: Set and Enable Time Constraint
- For example, we set the time constraint between View Product step and Add to Cart step for 5 minutes
- This means users who progress to the Add to Cart step from the View Product step within 5 minutes will only be included in the funnel progression.
- As you can see in the below screenshot, before and after applying the Time constraint we get the following results.
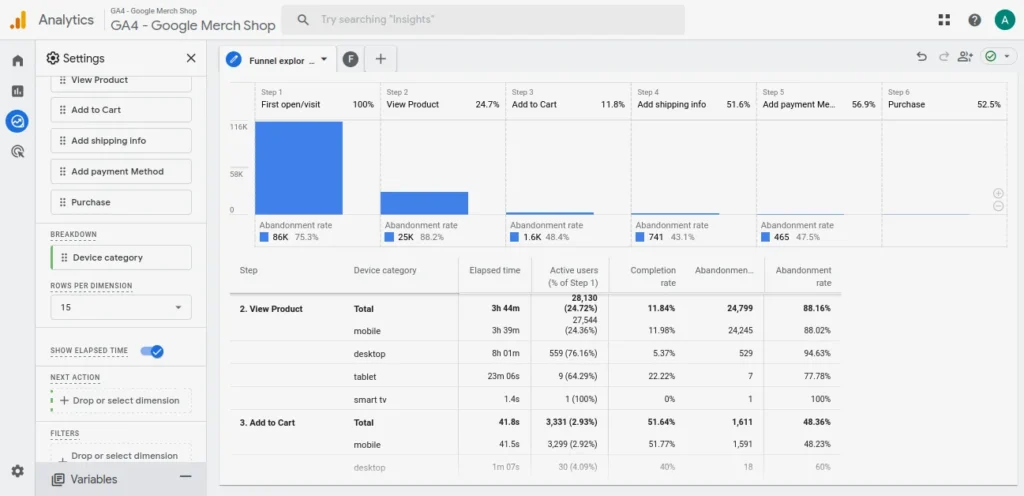
Screenshot 23: Before enabling Time Constraint
Is Directly and Indirectly followed by
- Directly Followed By: When one funnel step is directly followed by another, it means that the user must complete the next step immediately after the previous step, without any other intervening events or actions in between. This is useful when you want to enforce a strict sequence of actions in your analysis.
- Indirectly Followed By: When one funnel step is indirectly followed by another, it means the user can complete other actions or trigger other events between the two steps. The user can still move through the funnel as long as they eventually complete the next step, regardless of what they do in between.
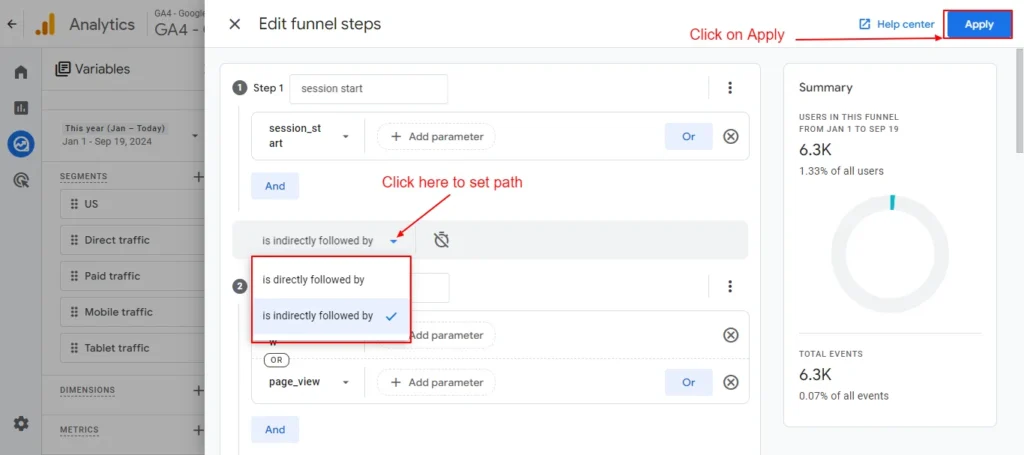
Screenshot 24: Choose between Directly and Indirectly, followed by
Step 6) Breakdown
- In Google Analytics 4 (GA4), the breakdown section (under the Settings panel) in a funnel report refers to a way of splitting or segmenting the data in each funnel step by a specific dimension.
- Below is the screenshot of the Device Category dimension used to break down the visualization.
- To add a breakdown, drag a dimension from the Variables panel or click the drop target to select it from the list.
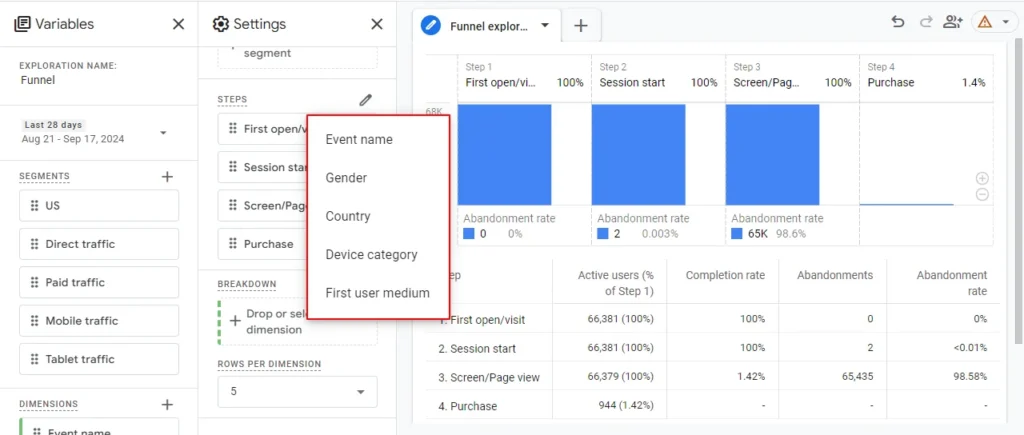
Screenshot 25: Click on the Breakdown drop target
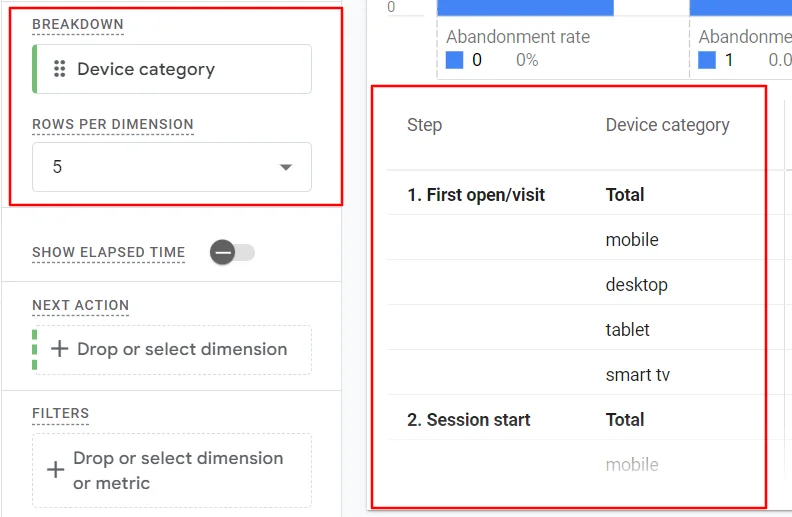
Screenshot 26: Select Device Category in Breakdown drop target
- After applying Device Category dimension, we can see the results of the report below.
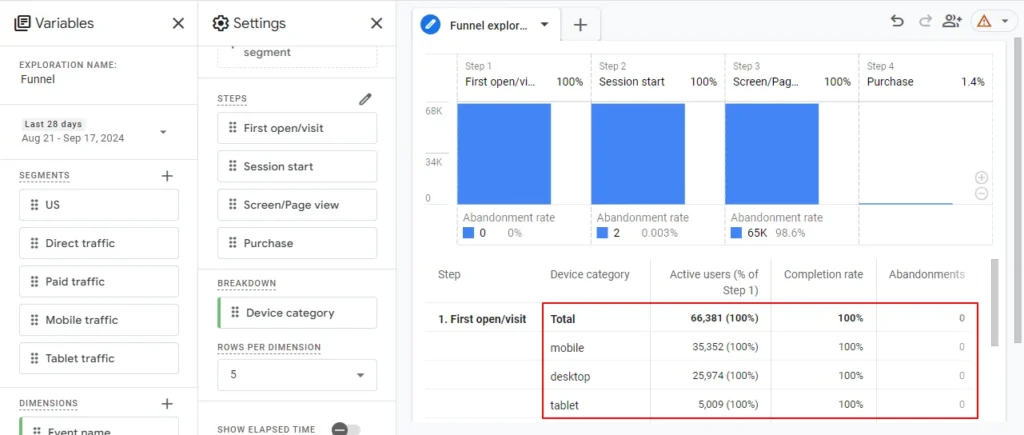
Screenshot 27: Results of Device Category Breakdown droplist
Step 7) Show Elapsed Time
- Show Elapsed Time in funnel exploration shows you how long it usually takes people to move from one funnel step to the next.
- It helps you analyze the time users spend between each stage of the funnel, offering insights into delays or areas where users might be taking longer to take action.
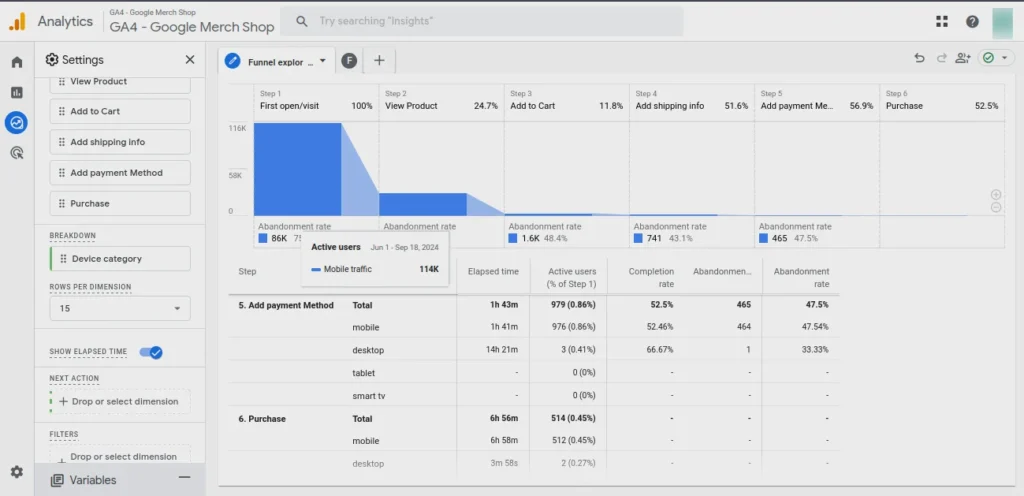
Screenshot 28: Elapsed Time
- As we can see, the elapsed time between the Add payment Method and Purchase step for the desktop is 3 minutes and 58 seconds.
Step 8) Next Action
- In Google Analytics 4 (GA4), the Next Action in funnel steps refers to the event or activity that users perform immediately after completing a particular step in the funnel.
- It helps identify what users do next, whether they move forward to the next step in the funnel, abandon it, or take a different action altogether.
- Under the Settings panel, click Next Action.
- A pop-up will appear with a list of dimensions that can be added in the Next Action as shown below screenshot.
- Note that only specific dimensions can be added as Next Action
- The following screenshot shows the Event Name and Page path + query string Dimensions can be added.
- Add the Event Name in Next action drop target.
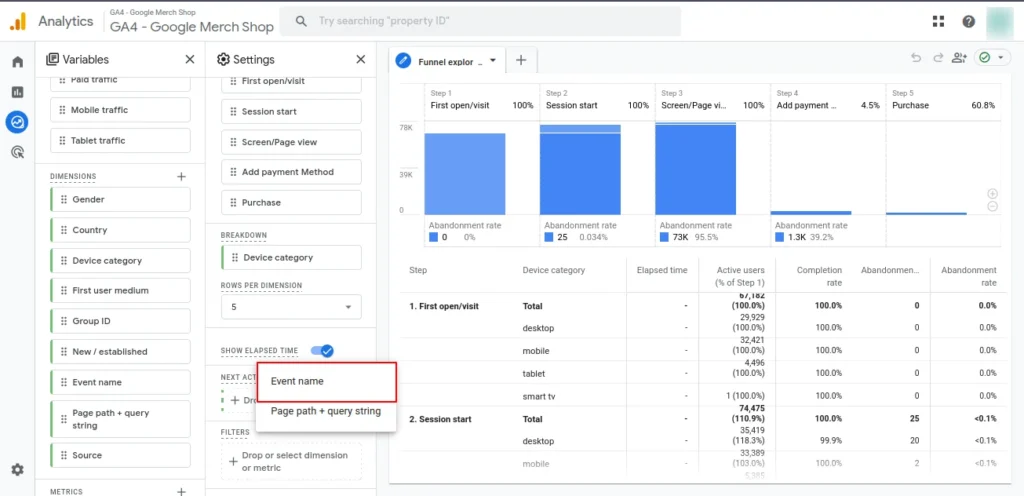
Screenshot 29: Event name as Next Action
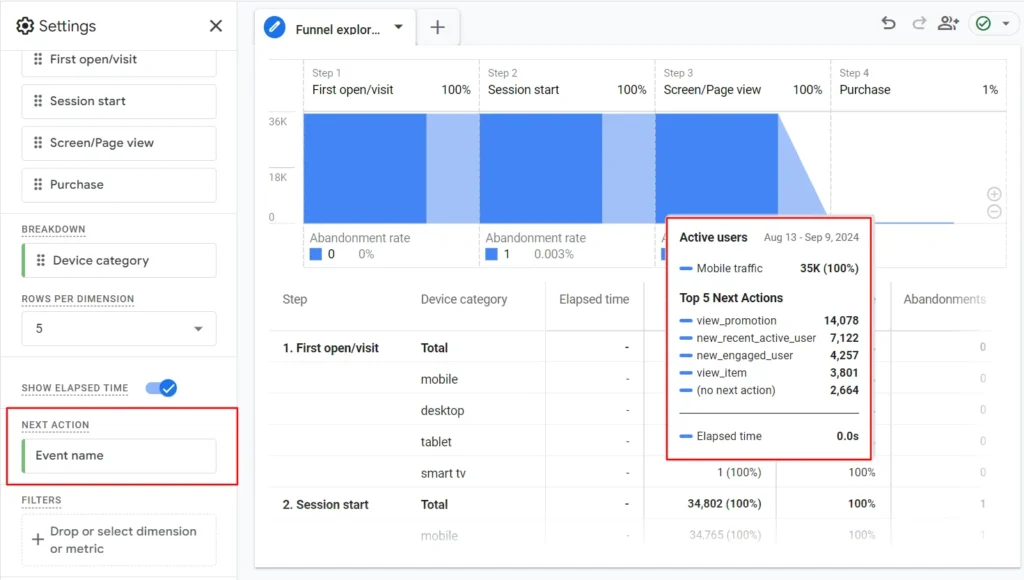
Screenshot 30: Results of Event Name as Next Action
- The screenshot above shows the top five possible next actions.
E-commerce Checkout Funnel: Example of a funnel Exploration report in Google Analytics 4
- In this sample report, we will analyze the customer journey through the e-commerce checkout funnel, focusing on key steps such as First Open/Visit, View Product, Add to Cart, Shipping, Add Payment, and Purchase.
- We will break down the funnel by Device categories such as mobile, desktop, tablet, and smart TV to explore differences in behavior.
- Additionally, we’ll evaluate key metrics like active users, elapsed time, funnel completion rates, abandonments, and abandonment rates at each step to help you identify where users drop off and optimize the funnel for better conversions.
- Following are the steps for creating the Funnel report.
Step 9) Create a Funnel Exploration
- In Google Analytics 4, go to the Explore tab.
- Click on the Blank exploration.
- Create a new exploration.

Screenshot 31: Select blank exploration
- Add exploration name as E-commerce Purchase Journey
- Set the date range. Let’s choose the range from June 1, 2024, to Sep 18, 2024.
- Set the visualization to the Standard funnel.
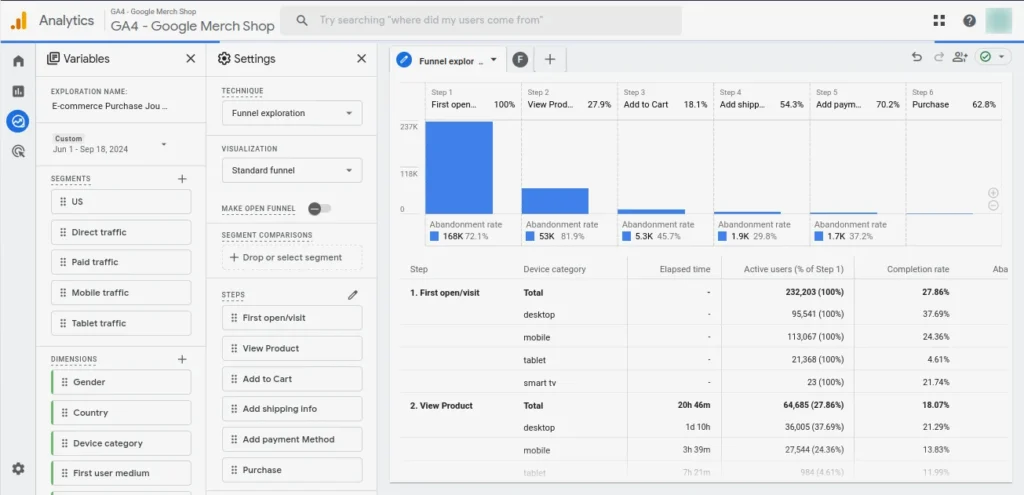
Screenshot 32: Set Exploration name and Visualization as Standard funnel
Step 10) Add and Edit steps
- Add the following steps to the funnel along with its event condition
- First Open/Visit:
- This is the first time the visitor has interacted with the site during their session.
- Event: first_open or first_visit
- View Product:
- Keeps track of when a user visits a certain product page.
- Event: view_item
- Add to Cart:
- Keeps track of when users add something to their shopping cart.
- Event: add_to_cart
- Add Shipping info:
- Keeps track of when customers add their shipping information during checkout.
- Event: add_shipping_info
- Add Payment method:
- The step where users add their payment information.
- Event: add_payment_info
- Purchase:
- The last step is when the purchase is done.
- Event: purchase or in_app_purchase
- First Open/Visit:
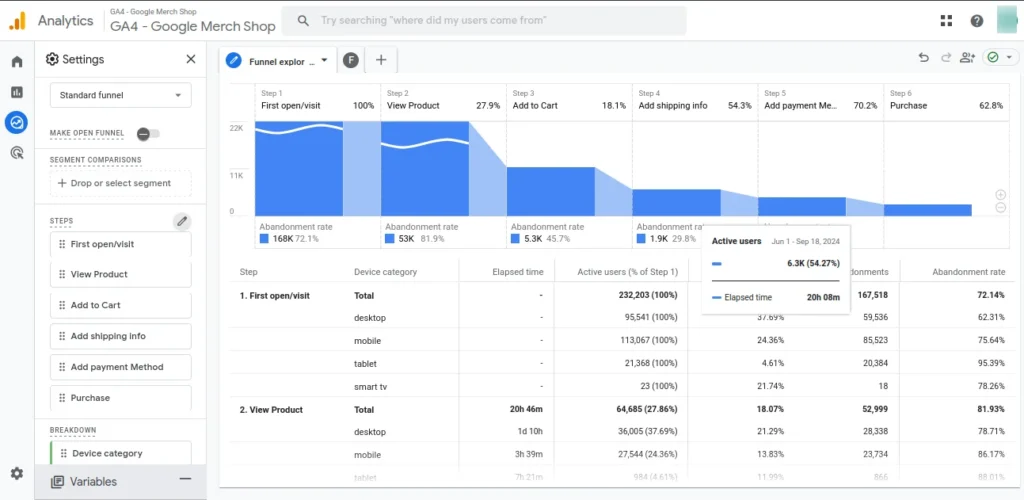
Screenshot 33: E-Commerce Purchase Journey Funnel Steps
- For this Funnel Exploration, we will Breakdown this report by Device Category.
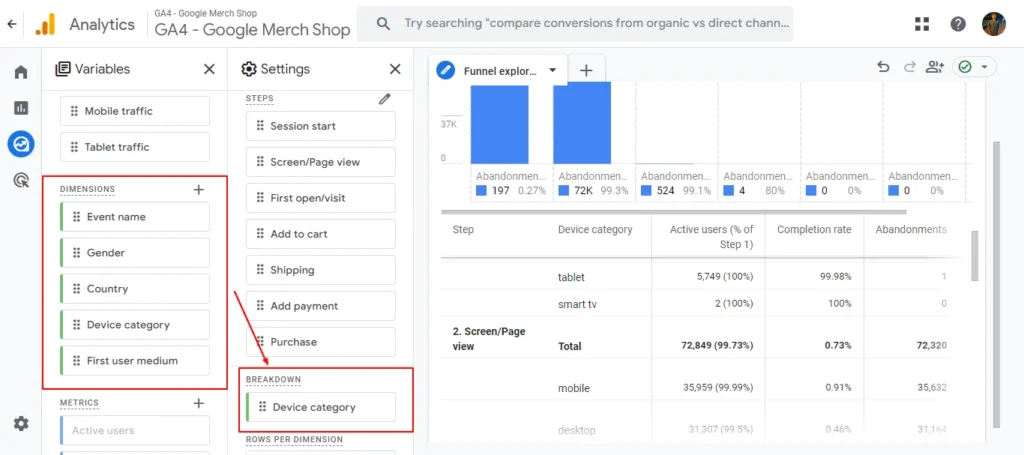
Screenshot 34: Device Category as Breakdown
- Set Next Action as the Event name.
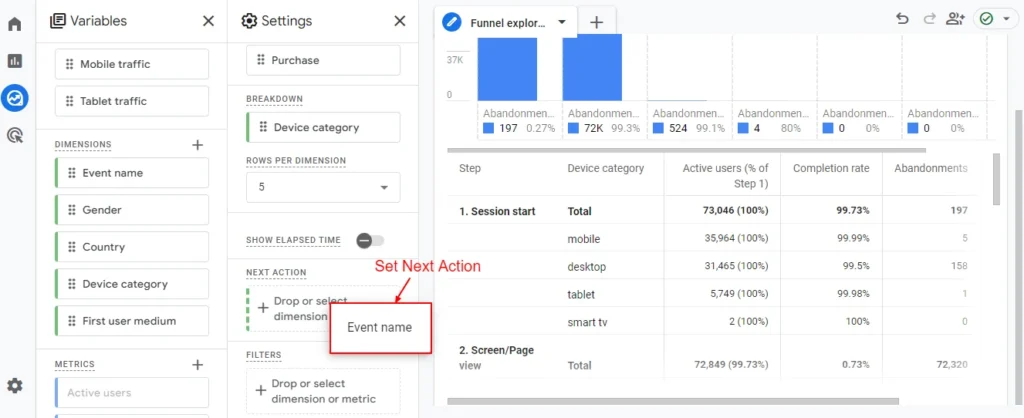
Screenshot 35: Set Event name as next action
- Activate Show Elapsed Time
- That’s it. Your funnel is ready.
Step 11) Analysis of E-commerce Purchase Journey Funnel
- The E-commerce Purchase Journey Funnel Exploration tracks key steps in the customer’s path, from viewing products to completing a purchase. It includes adding to the cart, entering shipping and payment details, and finalizing orders.
- Below are the insights from it.
First open/Visit
- Elapsed time: NA
- Active Users: 2,32,203(100%)
- Completion Rate: 27.86%
- Abandonments: 1,67,518
- Abandonment Rate: 72.14%
- Analysis: Most users abandon after the initial visit, with a high drop-off rate of 72%, indicating that many users leave before viewing products.
View Product
- Elapsed time: 20h 46m
- Active Users: 64,685
- Completion Rate: 18.07%
- Abandonments: 52,999
- Abandonment Rate: 81.93%
- Analysis: The majority of users who view a product abandon at this stage, with an 81.93% abandonment rate, suggesting issues in product engagement or relevance.
Add to Cart
- Elapsed time: 1d 19h
- Active Users: 11,686(5.03%)
- Completion Rate: 54.27%
- Abandonments: 5,344
- Abandonment Rate: 45.73%
- Analysis: Only 5% of users add items to the cart, but over half (54.27%) of users complete this step. There’s still a significant drop-off before checkout, with 45.73% abandoning.
Add shipping info
- Elapsed time: 20h 08m
- Active Users: 6,342 (2.73%)
- Completion Rate: 70.25%
- Abandonments: 1,887
- Abandonment Rate: 29.75%
- Analysis: 70% of users proceed after adding shipping info, with nearly 30% abandoning. This could indicate friction in shipping options or form complexity.
Add payment Method
- Elapsed time: 4h 36m
- Active Users: 4,455 (1.92%)
- Completion Rate: 62.81%
- Abandonments: 1,657
- Abandonment Rate: 37.19%
- Analysis: After adding payment info, 62.81% of users continue. The 37.19% abandonment may be due to payment-related issues, such as method availability or perceived security.
Purchase
- Elapsed time: 15h 11m
- Active Users: 2,798 (1.2%)
- Completion Rate: NA
- Abandonments: NA
- Abandonment Rate: NA
- Analysis: A small percentage of users (1.2%) complete the purchase, reflecting the final conversion rate.
Conclusion
In this blog, we explored how to create a Funnel Exploration from scratch in Google Analytics 4 (GA4). We covered the process of creating funnel steps, differentiating between open and closed funnels, and breakdown data by dimensions for more detailed analysis.
We even looked into an E-commerce Purchase Journey funnel that was built from scratch. We tracked the top events, such as product views, adding items to the cart, and purchasing, to know at which touchpoint users were dropping off.
In short, if you’re a marketer who wants to optimize conversion funnels or an eCommerce store owner looking to increase your sales, this exploration will provide insights that will help you to make better data-driven decisions.
